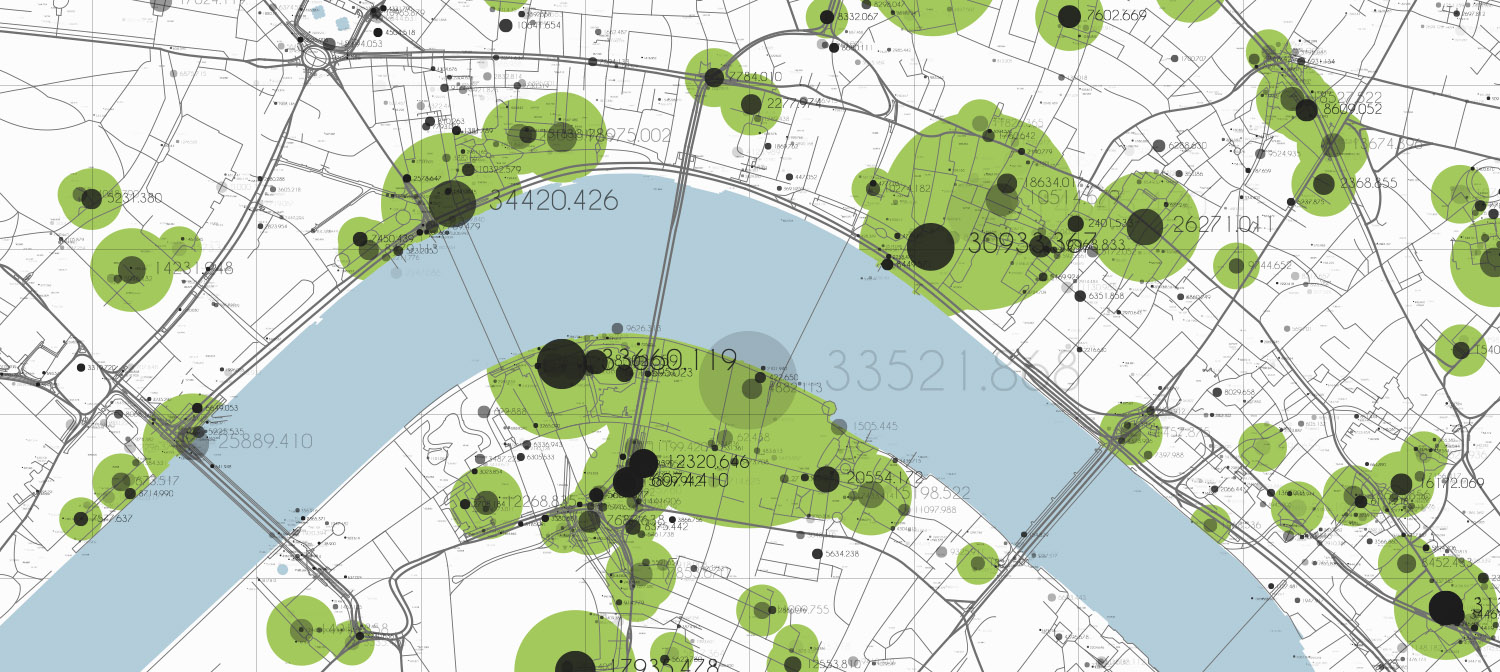
Data Visualisation
Data is visualised to enable us to harness the power of our visual system and spot relationships and trends. Identifying a trend in a table of data is not easy for most of us. If the same data is displayed as a line on a graph, the trend becomes obvious.

Without being able to see the numbers you should be able to see from the chart above that the amount of data being processed is growing exponentially over time and the proportion of data processed into information, knowledge and wisdom is also increasing over time.
Modern business intelligence tools make creating data visualisations easy. Creating data visualisations that help users to gain the correct insights quickly and easily is not. JRAH can help you pick and configure data visualisation components to bring your data to life.
